 iStateBar
iStateBar guide
Mac Memory Monitor: RAM, Cache & Swap
Used memory is only part of the story. Keep usage, cache and swap together, then use Activity Monitor for process-level diagnosis.
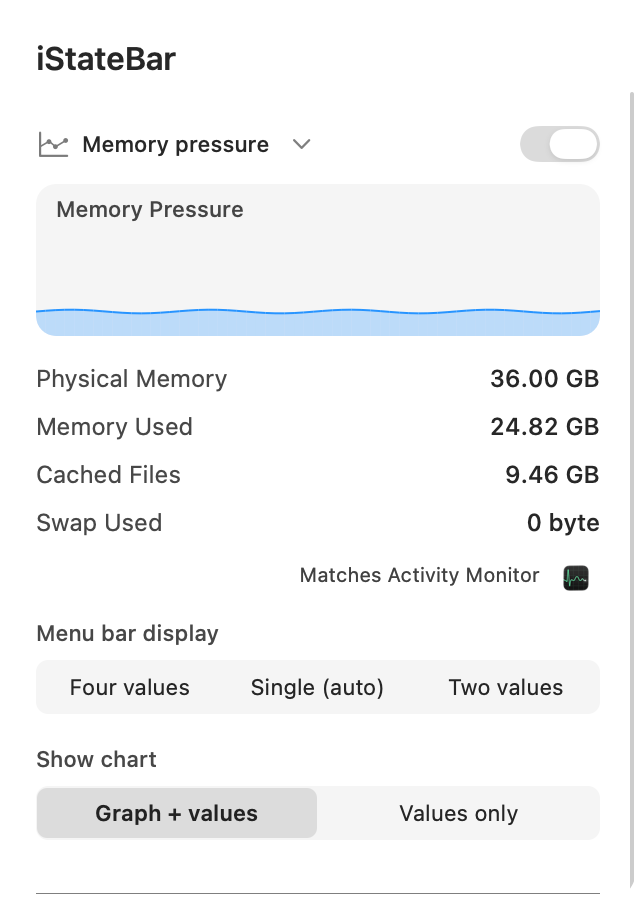
Read the values together
Physical memory
The RAM available to the system.
Memory used
The memory currently used by macOS and apps.
Cached files
Recently used data kept in RAM. Cache alone is not a reason to close apps.
Swap used
Disk space used to hold memory data. Read it alongside responsiveness and memory pressure.
A chart or a compact value?
In iStateBar, open Memory and choose the menu bar display. Four values show the full set. Two values keep the readout compact. Single (auto) adapts to the available space; its values-only view uses a circular memory gauge. Keep the chart when recent changes matter, or hide it when space matters more.
Check what is using RAM
For individual apps and processes, open Activity Monitor → Memory and inspect its Memory Pressure graph and process list. Apple explains that pressure combines factors such as free memory, swap rate and cached memory. A high used-memory number by itself does not establish a problem.
Keep the right signals visible
Set a clear memory color and place the module near CPU or temperature. Watch the history while launching an app or changing workloads. iStateBar makes those changes visible in the menu bar; it does not clear memory or quit processes for you.
Try it on your Mac.
7 days. All features. No signup.