 iStateBar
iStateBar guide
Mac CPU & GPU Monitor in the Menu Bar
See activity change while an export, browser tab or design app runs. Choose a readout that fits your menu bar.
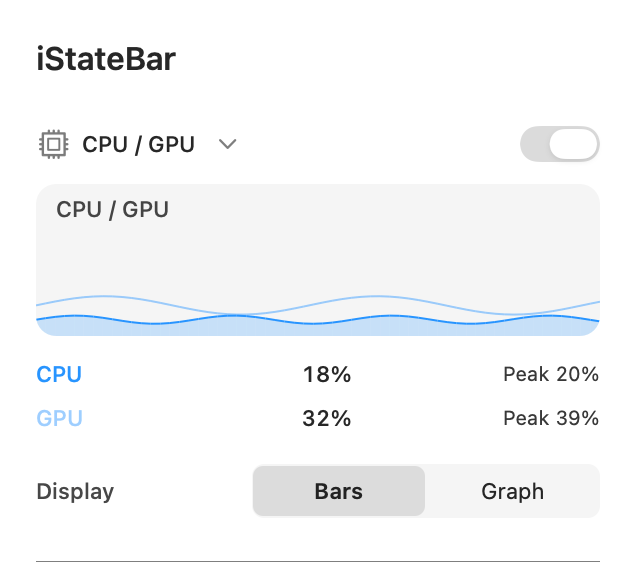
Choose a CPU / GPU display
Bars
Compact vertical indicators with numerical readouts.
Graph
Recent CPU and GPU activity, shown as separate colored traces.
Compact
A shorter numerical view when you want to save menu bar space.
Tell the two readings apart
CPU and GPU have independent colors. The labels use your chosen colors while percentage values stay neutral for readability. Use distinct colors so you can follow the two history traces without studying a legend each time.
Find the process behind a spike
iStateBar shows overall activity. To investigate a specific process, use Activity Monitor → CPU. Its process list helps you see which app is busy; Apple also provides CPU History and GPU History views. The percentages shown for a single process and overall system activity have different contexts, so compare like-for-like readings.
Keep a workload in perspective
Pair CPU / GPU with memory and temperature, then adjust chart length and spacing. A temporary rise during a render or export is different from a persistent rise at idle. Available GPU readings depend on the Mac and macOS. The website edition includes supported hardware readings; the planned App Store edition uses the optional Sensors companion for additional readings.
Try it on your Mac.
7 days. All features. No signup.